IDM PowerTips
Quickstart guide: Using the integrated PHP debugger
STEP 1: Install Apache/PHP/MYSQL Server
UEStudio supports debugging PHP scripts through integration with a web server run locally (Apache) and XDebug, which is installed and run externally. You can download the files you need for PHP Debugging by going to Advanced -> Configuration -> IDE -> Debugger -> XDebug -> Download.
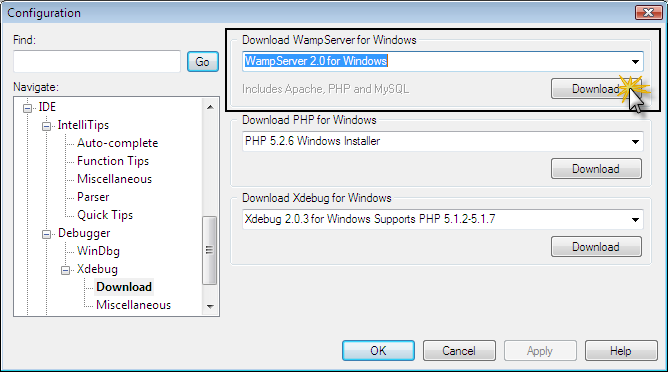
After you have downloaded the installation file you will need to run the installer. The installer wizard will guide you through the appropriate steps to install your development environment.
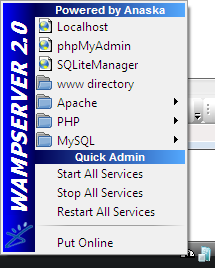
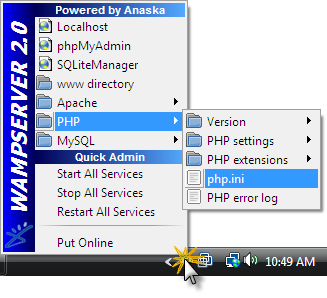
Now that you have installed the development environment, you should see the WAMP server icon in your system tray. You will need to ensure the server is running to use the debugger. If the server is not running, you can start the server by simply clicking on the WAMP icon in the system tray and selecting “Start all services”.
To test if the server is running, open a browser window and type http://localhost/. If the server is running, you should see a web page displayed.
STEP 2: Install Xdebug
Now that you’ve installed the server, The next step is to install Xdebug. To install Xdebug, click on the download button in the Xdebug section in Advanced -> Configuration -> IDE -> Debugger -> XDebug -> Download.
Please note, there are several build options for Xdebug offered in the dropdown. It is important to note which version of PHP is supported by the version of Xdebug you are downloading. You MUST select the version of Xdebug that supports the version of PHP which you’ve installed or Xdebug will not work with the version of PHP on your system.
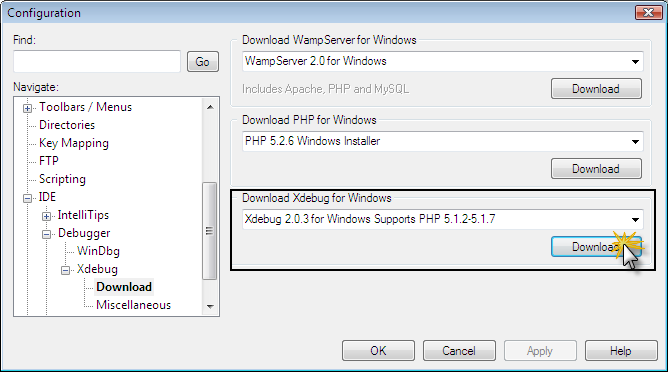
As you will see, the Xdebug download is a .dll. You will need to move the .dll to the directory that contains PHP. Per the WampServer install, the default lcoation would be:
C:\wamp\bin\php\php5.2.6\ext
In order for the server to “recognize” the Xdebug dll, you will need to edit the php.ini file. The easiest way to do this is to access the php.ini file through the WampServer menu:
Once you have opened this php.ini file, add the following lines at the end of the file:
 Xdebug location

zend_extension_ts="C:/wamp/bin/php/php5.2.6/ext/php_xdebug-2.0.3-5.2.5.dll"

;Xdebug settings

xdebug.remote_autostart = 0

xdebug.remote_enable = 1
Please note: You will need to modify the path to the dll as appropriate for your system.
Once you’ve made these changes, save the php.ini and close it. You will need to restart the server for these settings to take effect. To do this, select the option to Restart All Services in the WampServer menu in the system tray.
After restarting the services, if you open a browser and navigate to http://localhost/ you should see Xdebug listed as one of the loaded extensions.
Now that you have installed Apache, PHP, and XDebug, you are ready to begin debugging scripts in UEStudio!
STEP 3: Create a Project
For the debugger to work with UEStudio, you must create a PHP debugging project in UEStudio. The PHP debugging project is only used to store settings specified for the PHP debugger, PHP scripts do not have to be associated with the active project in any way for debugging to occur.
To create a project, go to the Project menu -> New Project/Workspace -> Create New Project…
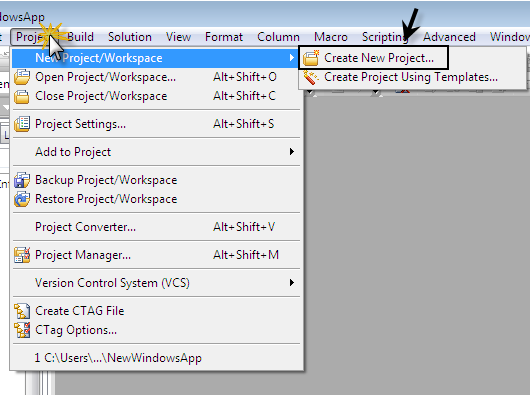
When prompted, type the desired project name and create the project. For our example, we are using “PHPDebug”.
After setting the project name, you will see the Project Settings dialog, click on the Debug tab and select “Integrated Xdebug” from the “Select Project Debugger” dropdown.
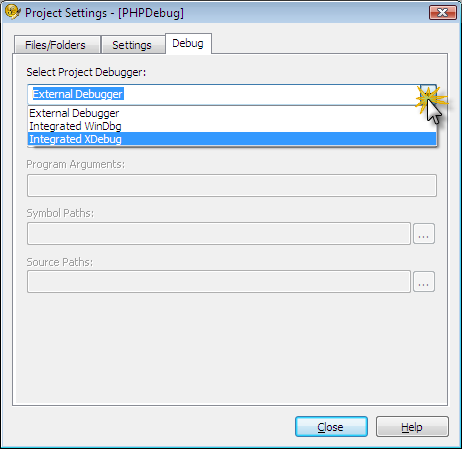
The Project Settings dialog is outside the scope of this Power Tip, but if you would like to learn more about projects, visit our “Project Settings” power tip.
STEP 4: Running the Debugger
Now that you’ve configured your server, Xdebug, and created a debugging project, you can start using the PHP Debugger.
To launch the debugger, go to the Build menu and select Start Debuger
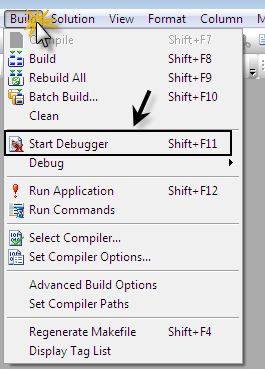
Alternatively, you can click the “Start Debugger” button on the debugger toolbar:
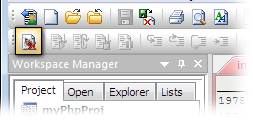
It is important to note that, once activated, the debug client works like a server by creating a port to which the debug engine can connect. Therefore, just starting the debugger does not necessarily mean a debug session will begin; the user must next run a script with debugging enabled. You can change this behavior by changing the remote_autostart property to “1” in the php.ini. Further information about this is available in the Help.
When Xdebug is invoked a dialog will appear:
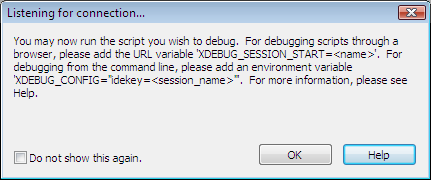
Click OK. At this point, UEStudio will begin “listening” for a connection on localhost as indicated in the output window:

Now, you can execute your script in debug mode (via the browser) by adding the URL variable ‘XDEBUG_SESSION_START=
http://localhost/index.php?XDEBUG_SESSION_START=myPHPTest

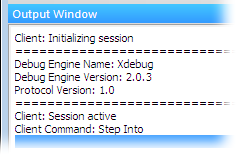
Once you press Enter to run the script in the browser (client), UEStudio will act as the server and will provide status updates on the script in the output window:
UEStudio will also open the active PHP script file (if it’s not already open) and indicate which line of the script is being executed:

Now that your debugging session is active, you may also notice that the debug toolbar buttons are activated. You can use the debug features for the purposes of debugging your PHP script:
For more information on the functionality of the debug toolbar, please see our integrated debugger tour page.
The call stack window and variables window will also be populated with information from your active PHP script, and a watch window is available for you to watch selected script components.
